/ April 2011 ~ Java EE Support Patterns

4.28.2011

java.net.socketinputstream.socketread0 hangs thread

This article will provide you a detailed explanation on how you can identify, resolve and prevent Thread hang problems involved in a java.net.socketinputstream.socketread0 blocking IO operation.

Proper understanding of these concepts is quite important when developing and supporting a Java EE production system since lack of proper timeout and understanding will eventually bring your system to its knees via Thread depletion.

Background

Modern Java EE production systems usually rely heavily on remote service providers for its various business processes. Such service providers are referred as downstream systems. For example: you may need to pull your client account data from an Oracle database or consume a remote Web Service SOAP/XML data. Regardless of the protocol used (HTTP, HTTPS. JDBC etc.) the Java VM will eventually be requested to establish a Socket connection from your production server to the remote service provider environment and then write / read data to / from the Socket. This process is referred as a “blocking IO call”.

The Thread involved in this blocking IO call can get hang for either:


·         Socket.connect() operation (establish a new physical connection between your production server and your remote service provider such as an Oracle database listener, a Web Service URL etc.)
·         Socket.write() operation (send the data to the service provider such as a database query request / SQL, an XML request data etc.)
·         Socket.read() operation  (wait for the service provider to complete its processing and consume the response data such as results of a database SQL query or an XML response data)


The third operation is what we will cover today.

In order to better help you visualize this process, find below a high level graphical view of the different operations and interactions: 

Problem identification: JVM Thread Dump to the rescue! 

Generating a JVM Thread Dump is the best and fastest procedure to quickly pinpoint the source of the slowdown and identify which Socket operation is hanging. The example below is showing you a JBoss Thread hanging in a Socket.read() operation triggered from a Web Service HTTPS call. You can also refer to this JBoss problem post for the complete case study and root cause analysis.

The first line of the Thread Stack trace will always show you which type of Socket operation is hanging.

"http-0.0.0.0-8443-102" daemon prio=3 tid=0x022a6400 nid=0x1bd runnable [0x78efb000]
   java.lang.Thread.State: RUNNABLE
        at java.net.SocketInputStream.socketRead0(Native Method)
        at java.net.SocketInputStream.read(SocketInputStream.java:129)
        at com.sun.net.ssl.internal.ssl.InputRecord.readFully(InputRecord.java:293)
        at com.sun.net.ssl.internal.ssl.InputRecord.read(InputRecord.java:331)
        at com.sun.net.ssl.internal.ssl.SSLSocketImpl.readRecord(SSLSocketImpl.java:789)
        - locked <0xdd0ed968> (a java.lang.Object)
        at com.sun.net.ssl.internal.ssl.SSLSocketImpl.readDataRecord(SSLSocketImpl.java:746)
        at com.sun.net.ssl.internal.ssl.AppInputStream.read(AppInputStream.java:75)
        - locked <0xdd0eda88> (a com.sun.net.ssl.internal.ssl.AppInputStream)
        at java.io.BufferedInputStream.fill(BufferedInputStream.java:218)
        at java.io.BufferedInputStream.read1(BufferedInputStream.java:258)
        at java.io.BufferedInputStream.read(BufferedInputStream.java:317)
        - locked <0xddb1f6d0> (a java.io.BufferedInputStream)
        at sun.net.www.http.HttpClient.parseHTTPHeader(HttpClient.java:687)
        at sun.net.www.http.HttpClient.parseHTTP(HttpClient.java:632)
        at sun.net.www.http.HttpClient.parseHTTP(HttpClient.java:652)
        at sun.net.www.protocol.http.HttpURLConnection.getInputStream(HttpURLConnection.java:1072)
        - locked <0xdd0e5698> (a sun.net.www.protocol.https.DelegateHttpsURLConnection)
        at java.net.HttpURLConnection.getResponseCode(HttpURLConnection.java:373)
        at sun.net.www.protocol.https.HttpsURLConnectionImpl.getResponseCode(HttpsURLConnectionImpl.java:318)
        at org.jboss.remoting.transport.http.HTTPClientInvoker.getResponseCode(HTTPClientInvoker.java:1269)
        at javax.servlet.http.HttpServlet.service(HttpServlet.java:802)  
 ………………………………………………………………………………………………

Root cause and resolution

As seen in the above diagram, the most common scenario for a hanging Socket.read() is a high processing time or unhealthy state of your remote service provider. This means that you will need to communicate with the service provider support team right away in order to confirm if they are facing some slowdown condition on their system.

Your applicaton server Threads should be released once the remote service provider system problem is resolved but quite often you will need to restart your server instances (Java VM) to clear all the hanging Threads; especially if you are lacking proper timeout implementation.

Other less common causes include:

-       Huge response data causing increased elapsed time to read / consume the Socket Inputstream e.g. such as very large XML data. This can be proven easily by analysing the size of the response data
-       Network latency causing increased elapsed time in data transfer from the service provider to your Java EE production system. This can be proven by running some network sniffer between your production server and the service provider and determine any major lag/latency problem

Problem prevention: timeout implementation!

Too many Thread hanging in a IO blocking calls such as Socket.read() can lead to a rapid Thread depletion and full outage of your production enviroment, regardless of the middle ware vendor you are using (Oracle Weblogic, IBM WAS, Red Hat JBoss etc,.).

In order to prevent and reduce the impact of such instability of your service providers, the key solution is to implement proper timeout for all 3 Socket operations.  Implementation and validation of such timeout will allow you to cap the number of time you are allowing the application server Thread to wait for a particular the Socket operation. Most modern communication APIs today allow you to setup such timeout fairly easily.

I also recommend that you perform negative testing in order to simulate such service provider instability / slowdown. This will ensure that your timeouts are working properly and that your production system will be able to survive during these negative scenarios.

Conclusion

I hope this article has helped you better understand the source and root cause of these hang Threads that you see in your environment and how to analyse and take some corrective actions. My next article will provide you with more detail on timeout implementations and methods available from various communication APIs.

Please don't hesitate to add a comment or email me if you still have questions or doubts on this type of problem.
4.20.2011

Class loader memory leak debugging tutorial for IBM VM

This article will provide you with a step by step tutorial on how you can pinpoint root cause of Java class loader memory leak related problems.

A recent class loader leak problem found from a Weblogic Integration 9.2 production system on AIX 5.3 (using the IBM Java VM 1.5) will be used as a case study and will provide you with complete root cause analysis steps.

  
Environment specifications (case study)

·        Java EE server: Oracle Weblogic Integration 9.2 MP2
·        OS: AIX 5.3 TL9 64-bit
·        JDK: IBM VM 1.5.0 SR6 - 32-bit
·        Java VM arguments: -server -Xms1792m -Xmx1792m -Xss256k
·        Platform type: Middle tier - Order Provisioning System


Monitoring and troubleshooting tools

·        IBM Thread Dump (javacore.xyz.txt format)
·        IBM AIX 5.3 svmon command
·        IBM Java VM 1.5 Heap Dump file (heapdump.xyz.phd format)
·        IBM Support Assistant 4.1 - Memory Analyzer 0.6.0.2 (Heap Dump analysis)

Introduction

Java class loader memory leak can be quite hard to identify. The first challenge is to determine that you are really facing a class loader leak vs. other Java Heap related memory problems. Getting OutOfMemoryError from your log is often the first symptom; especially when the Thread is involved in a class loading call, creation of Java Thread etc.

If you are reading this article, chances are that you already did some analysis and are suspecting a class loader leak at the source of your problem. I will still show how you can confirm your problem is 100% due to a class loader leak.


Step #1 – AIX native memory monitoring and problem confirmation

Your first task is to determine if your memory problem and/or OutOfMemoryError is really caused by a depletion of your native memory segments. If you are not familiar with this, I suggest you first go through my other article that will explain you how to monitor native memory on AIX 5.3  of your IBM Java VM process on AIX 5.3.

Using the AIX svmon command, the idea is to monitor and build a native memory comparison matrix, on a regular basis as per below. In our case study production environment, the native memory capacity is 768 MB (3 segments of 256MB).

As you can see below, the native memory is clearly leaking at a rate of 50-70MB daily.

Date
Weblogic Instance Name
Native Memory (MB)
Native memory delta increase (MB)
20-Apr-11
Node1
530
+ 54 MB
Node2
490
+65 MB
Node3
593
+70 MB
Node4
512
+50 MB


Date
 Weblogic Instance Name
Native Memory (MB)
19-Apr-11
Node1
476
Node2
425
Node3
523
Node4
462
 

This approach will allow you to confirm that your problem is related to native memory and also understand the rate of the leak itself.


Step #2 – Loaded classes and class loader monitoring

At this point, the next step is to determine if your native memory leak is due to class loader leak. Java objects like class descriptors, method names, Threads etc. are stored mainly in the native memory segments since these objects are more static in nature.

A simple way to keep track on your class loader stats is to generate a few IBM VM Thread Dump on a daily basis as per below explanations:

First, identify the PID of your Java process and generate a Thread Dump via the kill -3 command.


 ** kill -3 is actually not killing the process, simply generating a running JVM snapshot and is really low risk for your production environment **

This command will generate an IBM VM format Thread Dump at the root of your Weblogic domain.

Now open the Thread Dump file with an editor of your choice and look for the following keyword:

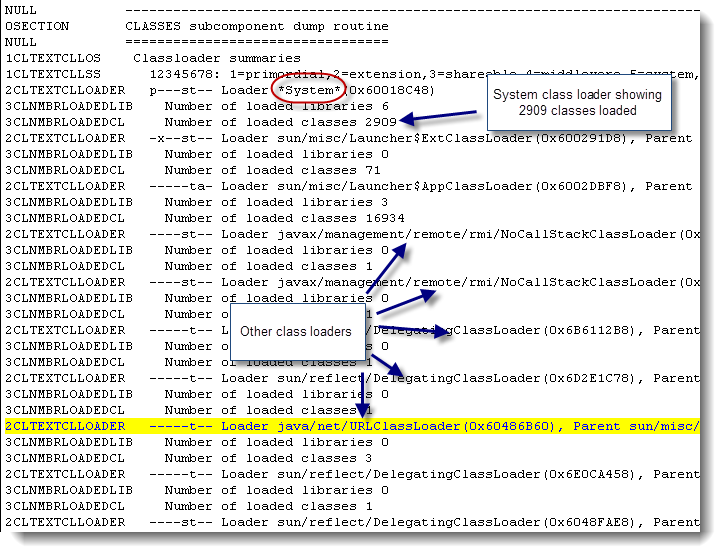
CLASSES subcomponent dump routine

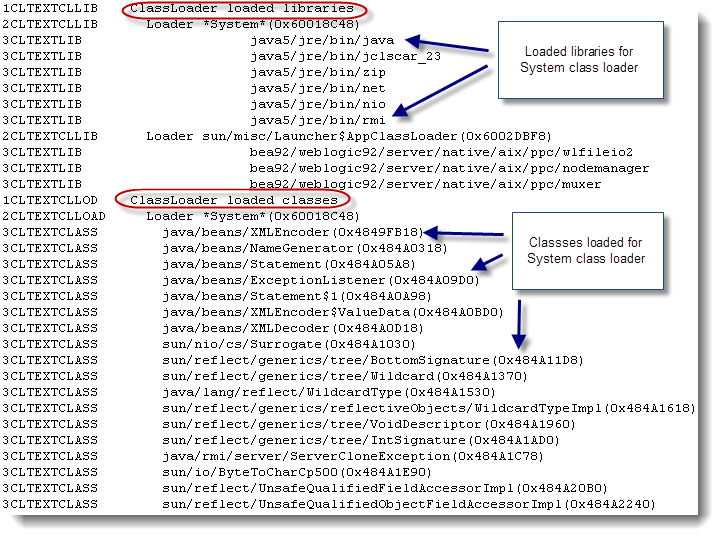
This section provides you full detail on the # of class loaders in your Java VM along with # of class instances for each class loader


You can keep track on the total count of class loader instances by running a quick grep command:

grep -c  '2CLTEXTCLLOAD' <javacore.xyz.txt file>

You can keep track on the total count of class instances by running a quick grep command:

grep -c '3CLTEXTCLASS' <javacore.xyz.txt file>

For our case study, the number of class loaders and classes found was very huge and showing an increase on a daily basis.

·        3CLTEXTCLASS : ~ 52000 class instances
·        2CLTEXTCLLOAD: ~ 21000 class loader instances


Step #3 – Loaded classes and class loader delta increase and culprit identification

This step requires you to identify the source of the increase. By looking at the class loader and class instances, you should be able to fairly easily identify a list of primary suspects that you can analyse further. This could be application class instances or even Weblogic classes. Leaking class instances could also be Java $Proxy instances created by dynamic class loading frameworks using the Java Reflection API.

In our scenario, we found an interesting leak of the number of $ProxyXYZ class increases referenced by the Weblogic Generic class loader.


This class instance type was by far the #1 contributor for all our class instances. Further monitoring of the native memory and class instances did confirm that the source of delta increase of class instances was due to a leak of $ProxyXYZ related instances.

Such $Proxy instances are created by the Weblogic Integration 9.2 BPM (business process management) engine during our application business processes and normally implemented and managed via  java.lang.ref.SoftReference data structures and garbage collected when necessary. The Java VM is guaranteed to clear any SoftReference prior to an OutOfMemoryError so any such leak could be a symptom of hard references still active on the associated temporary Weblogic generic class loader.

The next step was to analyze the generated IBM VM Heap Dump file following an OutOfMemoryError condition.


Step #4 - Heap Dump analysis

A Heap Dump file is generated by default from the IBM Java VM 1.5 following an OutOfMemoryError. A Java VM heap dump file contains all information on your Java Heap memory but can also help you pinpoint class loader native memory leaks since it also provides detail on the class loader objects as pointers to the real native memory objects.

Find below a step by step Heap Dump analysis conducted using the ISA 4.1 tool (Memory Analyzer).

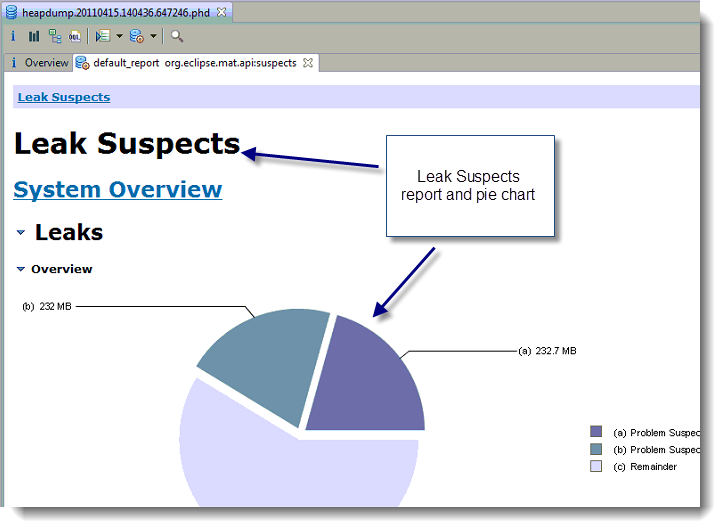
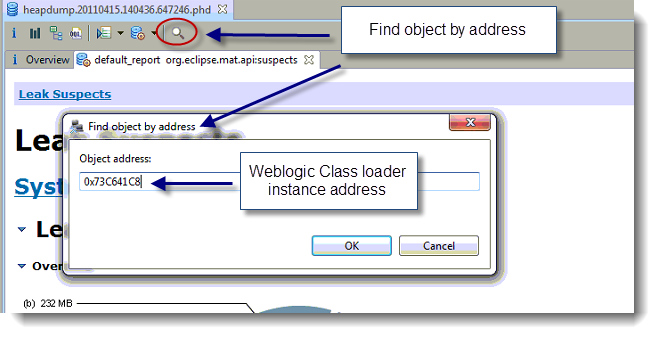
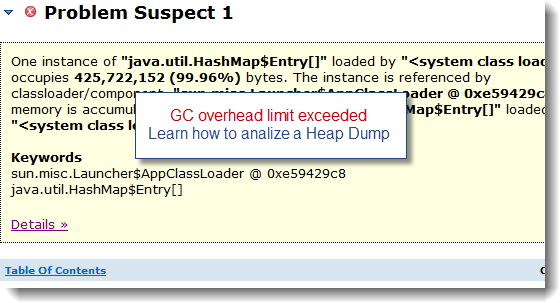
1) Open IAS and load the Heap Dump (heapdump.xyz.phd format) and select the Leak Suspects Report in order to have a look at the list of memory leak suspects

2) Once you find the source of class instance leak, the easiest way to analyze next is to use the find by address function from the tool and deep dive further

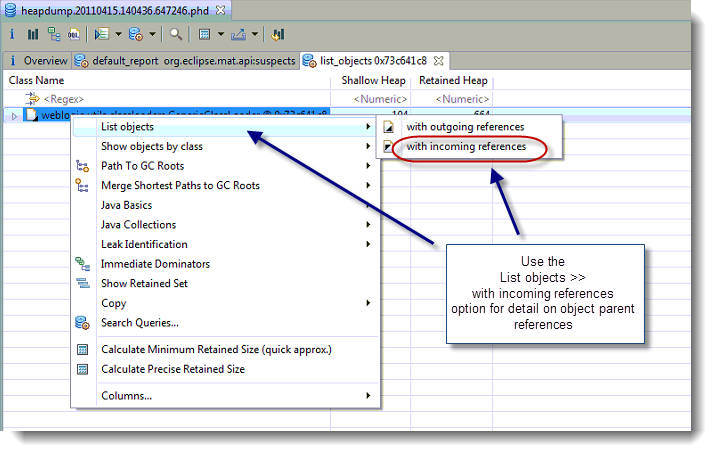
 ** In our case, the key question mark was why the Weblogic class loader itself was still referenced and still keeping hard reference to such $Proxy instances **


3) The final step was to deep dive within one sample of Weblogic Generic class loader instance (0x73C641C8) and attempt to pinpoint the culprit parent referrer


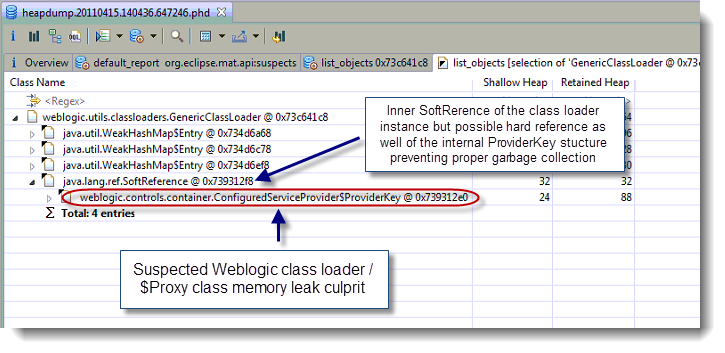
As you can see from the snapshot, the inner class weblogic/controls/container/ConfiguredServiceProvider$ProviderKey was identified as the primary suspect and potential culprit of the problem. 


Potential root cause and conclusion

As per the Heap Dump analysis. This data structure appear to be maintaining a list of java.lang.ref.SoftReference for the generated class loader instances but also appear to be holding hard references; preventing the Java VM to garbage collect the unused Weblogic Generic class loader instances and its associated $Proxy instances.

Further analysis of the Weblogic code will be required by Oracle support along with some knowledge base database research as this could be a known issue of the WLI 9.2 BPM.

I hope this tutorial will help you in your class loader leak analysis when using an IBM Java VM, please do not hesitate to post any comment or question on the subject.


Solution and next steps

We are discussing this problem right now with the Oracle support team and I will keep you informed of the solution as soon as possible so please stay tuned for more update on this post.

4.06.2011

Java Heap leak using Weblogic 10.0 and Apache Lucene 2.3.2

This case study describes the complete root cause analysis of a Java Heap leak problem experienced with Oracle Weblogic 10 and using the open source text search engine Apache Lucene 2.3.2.

Environment specifications

·         Java EE server: Oracle Weblogic Portal 10.0
·         OS: Solaris 10 64-bit
·         JDK: Sun Java HotSpot 1.5.0_11-b03 32-bit
·         Java VM arguments: -XX:PermSize=512m -XX:MaxPermSize=512m -XX:+UseParallelGC  -Xms1536m -Xmx1536m -XX:+HeapDumpOnOutOfMemoryError
·         Search Engine API: Apache Lucene 2.3.2
·         Platform type: Portal application

Monitoring and troubleshooting tools
·         VisualGC 3.0 (Java Heap monitoring)
·          IBM Support Assistant 4.1 - Memory Analyzer 0.6.0.2 (Heap Dump analysis)

Problem overview

-          ·        Problem type: Java Heap memory leak observed via JConsole monitoring


A Java Heap leak was detected in our production environment following a capacity planning initiative of a the Java EE environment and infrastructure which involved close data monitoring and analysis.

This finding did also explain why the support team had to restart the Weblogic environment on a weekly in order to avoid severe performance degradation. A degradation of performance of a Java EE server over time is often the symptom of a memory/resource leak.

Gathering and validation of facts

As usual, a Java EE problem investigation requires gathering of technical and non technical facts so we can either derived other facts and/or conclude on the root cause. Before applying a corrective measure, the facts below were verified in order to conclude on the root cause:

·        What is the client impact? HIGH (if Weblogic is not restarted every week)
·        Recent change of the affected platform? No
·        Any recent traffic increase to the affected platform? No
·        Since how long this problem has been observed?  This problem has been identified since several months but no corrective action taken until then
·        Is the Java Heap depletion happening suddenly or over time? It was observed via VisualGC that the Java Heap (old generation space) is increasing over time with a full depletion rate of ~7 days
·        Did a restart of the Weblogic server resolve the problem? No, Weblogic restart currently used as a mitigation strategy and workaround only

·         Conclusion #1: The problem is related to a memory leak of the Java Heap space with a full Java Heap depletion / failure rate of ~ 10 days

Java Heap monitoring

The Java Heap old generation and Eden space were both monitored using Java VisualGC 3.0 monitoring tool. The review of the VisualGC data was quite conclusive on the fact that our application is leaking the Java Heap old gen space on a regular basis. The next logical step was the Heap Dump analysis.

JVM running for 6 days and 7 hours


JVM running for 7 days and 8 hours


JVM running for 8 days and 7 hours


Heap Dump analysis

Find below a step by step Heap Dump analysis conducted using the ISA 4.1 tool (Memory Analyser).

1) Open IAS and load the Heap Dump (hprof format)

2) Select the Leak Suspects Report in order to have a look at the list of memory leak suspects

3) As per below, the Apache Lucene org.apache.lucene.store.RAMInputStream object was identified as our primary leak suspect

4) The final step was to deep dive within one of the Lucene object in order to identify the source of the leak


Conclusion

The primary Java Heap memory leak seems to originate from the Apache Lucene framework and due java.lang.ThreadLocal variables still maintaining reference to org.apache.lucene.store.RAMInputStream instances with memory footprint up to 30 MB for each instance.

Root cause and solution: Apache Lucene bug report #1383!

We did some research on the Apache issue tracking system and found a bug ISSUE-LUCENE-1383 reported back in 2008 which did correlate with our Heap Dump analysis findings. Find below a description of the problem:

"Java's ThreadLocal is dangerous to use because it is able to take a surprisingly very long time to release references to the values you store in it. Even when a ThreadLocal instance itself is GC'd, hard references to the values you had stored in it are easily kept for quite some time later.

While this is not technically a "memory leak", because eventually (when the underlying Map that stores the values cleans up its "stale" references) the hard reference will be cleared, and GC can proceed, its end behaviour is not different from a memory leak in that under the right situation you can easily tie up far more memory than you'd expect, and then hit unexpected OOM error despite allocating an extremely large heap to your JVM.”

“The patch adds CloseableThreadLocal. It's a wrapper around ThreadLocal that wraps the values inside a WeakReference, but then also holds a strong reference to the value (to ensure GC doesn't reclaim it) until you call the close method. On calling close, GC is then free to reclaim all values you had stored; regardless of how long it takes ThreadLocal's implementation to actually release its references.“


This problem was fixed starting in Apache Lucene version 2.4.

Solution and next steps

The solution will require an upgrade of Apache Lucene from version 2.3.2 to 3.1. The project is still in the early analysis phase and I will provide an update and results as soon as available.