


Most Java
developers are familiar with the concept of “memory leaks”. In the Java world,
it essentially means the constant expansion of a particular memory space such
as the Java
heap, PermGen
& Metaspace
(Java 8) or the native memory. Such leaks are often the result of Java code
problems from your applications, third part API’s or even inside the Java EE
container and JDK code base. The level of complexity to pinpoint and resolve
these types of problems can vary from medium to very high.
The good
news is that the JVM has evolves into a great piece of engineering. The GC
algorithms, troubleshooting and runtime data exposure capabilities of the JVM
are now quite mature. We have access to most critical runtime data via the JMX
API. All JVM vendors also provide JVM Thread
Dump & Heap
Dump generation techniques. Finally, we also have access to a great arsenal
of tools and Java profilers to monitor the JVM internals and analyze memory
dumps such as JVisualVM, Eclipse
MAT or other commercial products.
That being
said, even with the help of all these tools, the analysis process of Java
memory leaks remains quite challenging. The skillset requirement for
individuals performing such analysis is also high since it requires proper
knowledge of the Java heap, troubleshooting and runtime analysis techniques.
I recently
had the chance to experiment with the latest version of a Java memory leak analyzer
tool that I’m sure you heard about: Plumbr.
Plumbr’s approach can be resumed as this: instead of analyzing the memory dumps
“after the fact” or following an OutOfMemoryError
condition, why not writing a program that keeps tract of the Java objects and
detect precisely memory leak suspects at runtime…and with live production traffic?
This
article will share the positive experience I had with this product while experimenting
and “engineering” a Java heap memory leak with the latest version of WildFly (formerly known as JBoss AS). I will
also share my personal tips on how to improve your troubleshooting experience with
Plumbr by combining additional tools or “synergists”. A complete Plumbr
tutorial video will also be available from my YouTube channel
in the near future.
Plumbr has
also the capabilities to identify class loader related memory leaks affecting
the PermGen space of the HotSpot JVM. I may publish more articles in the future
addressing this particular type of leak with the help of Plumbr.
Memory leak simulator and environment
specifications
In order
to give Plumbr some challenges, the following memory leak was engineered:
- A JAX-RS (REST) Web Service was created and exposed
via the jvmleak
URI
as per below attributes.
@GET
@Path("/jvmleak")
@Produces(MediaType.APPLICATION_JSON)
public Integer jvmLeak() {}
Each
invocation of jvmleak is
performing the following logic:
1.
Allocate a high amount of short-lived objects
(no reference).
2.
Allocate a small amount of long-lived objects
(normal or hard references) to a static ConcurrentHashMap data structure.
3.
Returns the current count of the “leaking” ConcurrentHashMap.
We also
created 3 extra Java classes:
- JVMMemoryAllocator. This class is responsible to perform
the short-lived and long-lived memory allocations.
- ShortLivedObj. This class represents a short-lived
object with no reference.
- LongLivedObj. This class represents a long-lived object with hard references.
You will
find below the environment specifications and software’s used to create and
execute this Java heap memory leak simulator.
- OS: Windows 7 @64-bit
- Java EE container: WildFly
8 Alpha 3
- JVM: Oracle HotSpot 1.7 @64-bit with a Java heap
size of 2 GB
- IDE: JBoss Developer
Studio 7.0.0.GA
- JVM monitoring: JVisualVM
- JVM memory leak analyzer: Plumbr
3.0
- Performance & load testing: Apache JMeter 2.9
Plumbr download and installation
Plumbr is
packaged as a “trialware”. This means that you can download the full version
for free and determine if your application(s) contain memory leak(s). The
location of the memory leak (code level) will require your or your client to
purchase a Plumbr license plan
as per your needs.
I recommend that you first install Plumbr to
a development environment prior to production. Plumbr is a lightweight agent
but extra due diligence is always recommended in order to reduce risk for your
production environment.
- Login / register at https://portal.plumbr.eu/. This will allow you to download the Plumbr client.

- Unzip the archive at a location of your choice
(local environment, development server etc.).
- If your Java application is running on Windows OS, you can simply double click the plumbr.jar located under the Plumbr root directory or use the following command: java -jar plumbr.jar. This will launch the Plumbr client and allow you to “attach” it to a running JVM process. Another approach is to simply edit your application JVM start-up settings and add the following argument: -javaagent:<PLUMBR ROOT DIRECTORY>plumbr.jar. I personally prefer the second approach.
Now back
to our memory leak simulator, you will notice from the snapshot below that we
added the Plumbr agent reference to the WildFly JVM start-up arguments inside
the IDE directly.

After the
restart of your JVM process, you will notice a similar message at the beginning
of the standard output log:
************************************************************
* Plumbr (B1422) is attached. *
* Running with JRE from …\jdk1.7.0_09\jre *
* Your license is valid *
* for
20 more days *
* for
Pierre-Hugues Charbonneau. *
* Plumbr agent is connected to the Plumbr
Portal. *
* Open up https://portal.plumbr.eu to follow
its progress. *
************************************************************
This is
telling us that Plumbr is now active and connected to the Plumbr Portal or
reporting server. Now go to Plumbr portal
and verify if it is properly receiving data from your JVM process.

Memory leak simulator warm-up
Now that
the Plumbr agent is connected, it is now time to fire our memory leak
simulator. In order to simulate an interesting memory leak, we will use the
following load testing specifications:
- JMeter will be configured to execute our REST Web
Service URI jvmleak.
- Our JMeter thread group will be configured to run
“forever” with 20 concurrent threads.
- JvisualVM and the Plumbr Portal will both be used to monitor the Java heap utilization along with the internal Plumbr MBeans.

Please
note that launching JVisualVM is optional but I definitely recommend that you
use it in conjunction with the MBeans browser plugin (add-on for JVisualVM). This will
allow you to track the status and progress of the Plumbr agent directly from
JVisualVM. It is important to note you will need to generate load and get several
Full GC iterations before Plumbr is able to identify true memory leaks. The
elapsed time will also depend of the activity (load) and nature of your
application.

Since we
have not fire JMeter at this point, you can see that Plumbr is still in its
WARMUP phase with 10% completion.
Memory leak simulator execution
Generating
an adequate amount of load to your application will allow Plumbr to complete
its WARMUP phase fairly quickly. We can now see from our simulator that Plumbr
is in RUNNING state and tracking several thousands of objects already. However,
we had no Full GC at this point so we will need to wait until a few iterations
are performed. This will allow the internal Plumbr computing engine to do its
assessment and potentially narrow down the location of a memory leak.


You can notice that number of objects tracked by Plumbr will vary in between Full GC iterations. This is because Plumbr will typically only focus on objects that are “suspect” such as objects able to survive major collections (Full GC).
After a
few major collections, Plumbr was able to detect a potential memory leak with
98% confidence. We are almost there…It is important to note that no
OutOfMemoryError was thrown. The leak can also be observed from JVisualVM but
it is not that obvious such early in the load test life cycle.


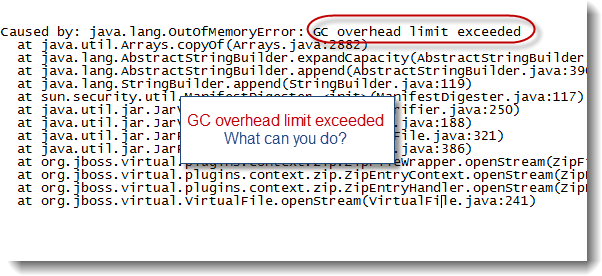
Finally,
after more major collections, Plumbr was able to detect a memory leak with a confidence
level of 100%. As you can see from the snapshots, JVisualVM did allow us to
easily monitor the Java heap and Plumbr MBeans status progressions.

You will
also notice the following message in the standard output logs.
15:22:41,270 INFO [stdout] (Plumbr thread - 176)
******************************************************************************
15:22:41,271 INFO [stdout] (Plumbr thread - 176) * Plumbr has
found a memory leak. *
15:22:41,271 INFO [stdout] (Plumbr thread - 176) * Plumbr will
now stop tracking to leave more resources for your application. *
15:22:41,271 INFO [stdout] (Plumbr thread - 176) * You can find
the detailed memory leak report by opening this url: *
15:22:41,272 INFO [stdout] (Plumbr thread - 176) *
https://portal.plumbr.eu/report/5515 *
15:22:41,272 INFO [stdout] (Plumbr thread - 176)
******************************************************************************
At this
point we have to wait for Plumbr to analyze the location and type of leak found.
Once the analysis process is completed, a report will be generated and
available from the Plumbr Portal.


Plumbr memory leak report
Plumbr 3.0
provides centralized memory leak report capabilities. Each time Plumbr is able
to detect a new memory leak, a report is created and uploaded to the reporting
Portal. We can see below that a new report was generated from our fresh memory
leak simulator execution.

The report
is the ultimate outcome and deliverable of this exercise: a precise location,
at code level, of where the memory leak is located.

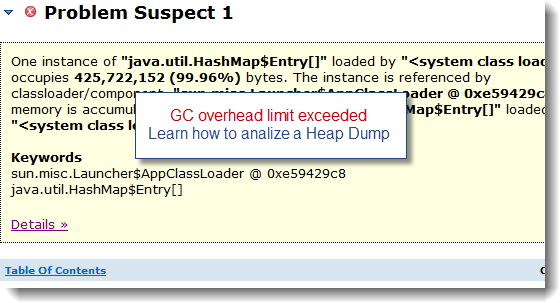
We can see
from the above report that Plumbr was perfectly able to identify our memory
leak. You can notice that the leak report is split into 4 main sections:
- The header contains the number of leaks found along
with the detail on the memory footprint occupied by the leaking objects
vs. the total Java heap capacity.
- Leaking object type:
This represents the object type
of the instances accumulating over time in between major collections.
- Leak creation location:
This represents the caller and Java class where the leaking objects are created.
- Memory references:
This represents the object reference tree where the leaking objects are
still referenced or held.
In our case, Plumbr was able to identify the exact location of our engineered memory leak.
- LongLivedObj is indeed the expected leaking object
type.
- JVMMemoryAllocator is definitely the Java class
where the leak is created.
- ConcurrentHashMap is the implemented "referencer" or
container.
Interestingly,
Plumbr was also able to identify another potential leak inside WildFly 8 Alpha
3 itself…
Now please
keep in mind that following the creation of the report, Plumbr will not
magically resolve the memory leak for you. You will need to spend some time and
review the affected code, especially the location where the leak is created and
understand why the objects are still referenced. Plumbr will do 50%+ of the
work. You will need to take care of the other half and determine the proper
code fix required, upgrade or patch of the offending API(s).
Final words
I hope
that you appreciated this tutorial and review of Plumbr 3.0 while simulating a
true Java heap memory leak. This product is looking quite promising and I
definitely recommend that you give Plumbr a try in your environment; especially
if you suspect that you are dealing with memory leak problems affecting your
production environment stability. Thumbs up to the Plumbr core team!
I’m
looking forward for your comments and please share your experience with Plumbr.